Economic Audit
Content
ABOUT THE ECONOMIC AUDITOR
Dr Stylianos (Stelios) Kampakis is a data scientist and blockchain expert with more than 10 years of experience in technology. He has worked with decision makers from companies of all sizes: from startups to organizations like the US Navy, Vodafone and British Land. His work expands multiple sectors including fintech (fraud detection and valuation models), sports analytics, healtech, general AI, medical statistics, predictive maintenance and others. He has worked with many different types of technologies, from statistical models, to deep learning to blockchain and he has 2 patents pending.
He was one of the first researchers in the area of tokenomics, as well as one of the first to create valuation models for NFTs.
He is a member of the Royal Statistical Society, honorary research fellow at the UCL Centre for Blockchain Technologies, editor at the Journal of the British Blockchain Association, a data science advisor for London Business School and CEO of The Tesseract Academy.
https://uk.linkedin.com/in/dr-stylianos-kampakisIntroduction
The BankX system is taking inspiration mostly from FRAX and Token Lockup Protocols where you earn rewards for locking up a token and mimics the price stabilization mechanisms of stablecoins in the market:
- Frax has proven that a combined algorithmic and collateralized stablecoins can work and are successful at maintaining the peg.
- Token Lock Up protocols have proven that it is possible to create a deflationary token supply by giving rewards for locking up your tokens.
Terminology
- Stablecoin: Any cryptocurrency whose intention is to provide a stable price with reference to a fiat currency or a commodity. Stablecoins are most commonly pegged to $1
- Algorithmic stablecoin: This refers to stablecoins, like Frax and Terra/Luna, that use market forces, arbitrage opportunities and software rules which automatically rebalance the stablecoin at the peg.
- Partial-collateralized system: This refers to a system that is partially collateralized by a recognized store of value (e.g. Frax), and partially algorithmically, using market forces and software rules as stablecoin price pegging. (e.g. Terra Luna).
- Token Lockup Rewards: Locking up BankX tokens for a certain period of time (which normally ranges in years), in exchange for more BankX tokens
- Minting: The act of staking the BankX token and the native blockchain currency (ETH, BNB) to receive XSD. The cryptocurrencies are staked for a certain period, and the user gets XSD in exchange.
- Redeeming XSD: Once a user returns the XSD they minted, they get back ETH/BNB and BankX tokens, plus interest in the form of more BankX tokens.
- Minting rewards interest ratio: The bonus that a user should expect from the process of minting XSD, and then redeeming XSD (after a certain period has passed decided entirely by the minter).
- Collateral ratio: The % of the native blockchain cryptocurrency (ETH or BNB) total value locked up in the smart contract.
- Collateral change: Whenever XSD goes above or below the peg, the system uses a PID controller to adjust the percentage collateral of the native blockchain cryptocurrency. This acts as an additional stablecoin price stabilization mechanism (adjusts 0.025% each time).
Goals of the analysis
- The peg doesn’t break. This is the number 1 goal of any stablecoin system.
- The BankX token’s price will not crash completely, or spike to unsustainable heights. In other words, the BankX token’s price should either be stable, or slowly appreciate over time.
- The BankX token is a store of wealth.
- The system is moving towards increased usage of the BankX token as collateral to mint XSD (meaning there is more and more demand for XSD).
- BankX has autonomous, sustainable liquidity pools.
- BankX token can achieve the goal of being Always Net Deflationary (A.N.D.).
Tools of the analysis
- Empirical proof: If something has been proven to work in other systems, then it is assumed that it can also work for BankX.
- Balance-of-forces analysis: It is assumed that if an action, within the system, applies an inflationary or deflationary force, this can always be balanced against another action/force within the same system. The actual magnitude forces applied depend on the economic levers in the protocol.
- Numerical analysis: when relevant, we will apply numerical techniques and simulations.
Assumptions
Dynamics influencing the BankX token price
From the perspective of the BankX token,
| Action | Inflationary pressure | Deflationary pressure | Levers |
|---|---|---|---|
| Token Lockup Rewards | Rewards are paid in BankX tokens, along with the principal, once the lock-up period is over | The lock-up period | Lock-up period, interest rate |
| Minting and earning interest | Interest paid when XSD is redeemed. | The staking period | Time XSD is in circulation, interest rate |
| Certificate of deposit | Interest is paid in BankX tokens, along with the principal, once the lock-up period is over | The lock-up period | Lock-up period, interest rate |
| Collateral ratio threshold mechanism | None | The actual change in collateral, as more BankX tokens are needed for collateral | The price differential between the peg and the actual price. (More demand for XSD) |
| Liquidity pool | In times of liquidity pool shortage, the system incentivizes users to sell liquidity to the BankX protocol where they earn a bonus in BankX tokens. This creates a long-term inflationary dynamic, but short term deflationary. | Interest rate, vesting schedule | |
| Bonding curves | Bonding curves issue BankX tokens as rewards, hence adding to the inflation of the system. | Bonding curves incentivize staking in the CD and adding collateral when there is a deficit. | The amount of reward and the vesting schedule for the reward. |
| Burning BankX tokens that reside in a liquidity pool | None | Removes supply | The system burns tokens only when inflation is too high. |
- Minting and earning interest:
The user can stake BankX tokens and the native blockchain cryptocurrency to get XSD. When the tokens are redeemed (XSD is given back into the system), the user gets rewards in the form of BankX tokens. The users cannot redeem when there is a collateral deficit.
- Token Lockup Rewards
The user can lock up their BankX tokens for a period of time to earn more BankX tokens after the end of this period. Token Lockup Rewards co-exist with the minting mechanism and provide two different types of use cases, depending on a user’s preferences. The long term effect of Token Lockup Rewards is deflationary.
- Collateral ratio threshold mechanism:
When XSD breaks its peg, and the value goes higher than 1 gram of silver expressed in USD, then the PID controller lowers the amount of the native blockchain token needed to mint by 0.025%, hence increasing the demand for the BankX token. The constant of 0.025% is a level that can be potentially adapted. However, it is what Frax currently uses.
- Liquidity pools:
Users are incentivized to sell liquidity to BankX. This makes BankX own part/all of its liquidity. This incentivization takes place through rewards which are determined by bonding curves (covered next).
- Bonding curves:
Bonding curves provide incentives to stake in the CD, add collateral to the stablecoin during times of collateral deficit and add to the liquidity pools in times of shortage of liquidity. The bonding curves of BankX is a way to ensure that the protocol has enough liquidity and collateral backing the stablecoin. This is a defensive mechanism that roughly works as follows.
- Staking ratio
This is the ratio of the users staking BankX tokens versus those who are claiming rewards. A small ratio can lead to an inflationary environment. While a proper analysis requires data from the usage of the system (as expectations, and user behavior can play an important role), it is self-evident that if the staking ratio is below 1 (less users staking than claiming rewards), the system might need some of the other levers in order to achieve the goal of A.N.D. (Always Net Deflationary).
- Burning tokens
If the system has become inflationary, it will burn newly sold BankX tokens into the liquidity pool until the systems stakers/reward claimers is back to the desired amount.
- Collateral
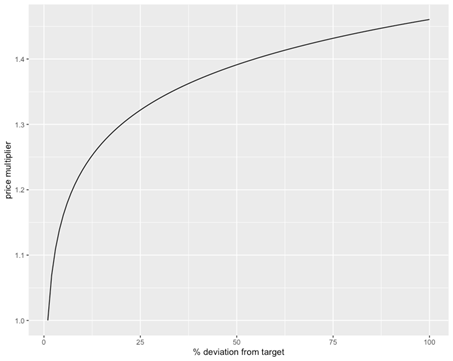
When the collateral ratio drops significantly, what is needed by the system vs. the actual collateral value (as discussed in the marginal cases below), BankX will issue a bonding curve that provides a reward that is equal to the collateral required to stabilize the system, plus a bonus. This is shown in the figure below.
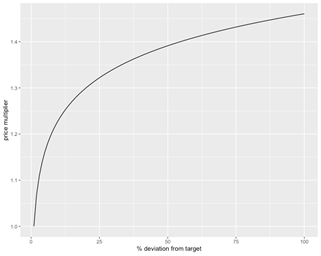
Example of how a bonding curve can provide larger reward based on the % deviation from the collateral target.
For example, in the curve above, if the system was missing 50% of the collateral target in ETH/BNB, then it would issue rewards in BankX tokens equal to about 140% of the collateral needed. These rewards would be provided over a vesting schedule, which can, in turn, be influenced by the actual size of the reward.
In general, the collateral affects the system in the following ways:
- Collateral Deficit – inflationary to pay rewards to add collateral
- Collateral Surplus – deflationary as the BankX tokens used to buy back the surplus collateral are burned
The figure below summarizes the different uses for the bonding curves.
Integrated Protocol Owned Liquidity
Typically, a new project rewards liquidity providers with more of their tokens to increase the returns beyond the transaction fees you would earn in decentralized exchanges. This concept is called “renting liquidity”. Then, someone would clone the project, increase the number of tokens given, pulling the liquidity to the cloned project. This can crash the original project.
Projects like Olympus DAO (and countless clones) have solved this liquidity problem by restructuring the incentives so that the protocol owns the liquidity. High yield seekers cannot run off with liquidity at the next higher returns project. Essentially, you get a bonus in tokens on a vesting schedule for selling to the liquidity pool. This liquidity is then owned by the protocol. It is similar to a bond and called POL’s (Protocol Owned Liquidity).
BankX has a similar system where the protocol owns the liquidity that is added by offering a bonus in BankX tokens for adding collateral to our liquidity pools. BankX minters and stakers can be assured that there will be a market for BankX tokens and XSD.
Adding to the Protocol Owned Liquidity innovation, BankX is the first to introduce the concept of an Integrated Protocol Owned Liquidity system (IPOL). Because the BankX protocol owns the liquidity pools, it can do things to ensure sound economic policy over projects that “rent liquidity”. The IPOL system is the last line of defense to maintain an Always Net Deflationary (A.N.D.) token economy.
The system does 2 things to get back to a deflationary environment when the system has identified the BankX token as “inflationary” (inflation is greater than staking):
1. 10% of newly sold BankX tokens into the Liquidity Pool (ETH/BNB vs. BankX LP only) are burned by the system.
2. If #1 doesn’t work, after a period of time, 1% of the total BankX tokens in the Liquidity Pool are burned each week until the system reaches a net deflationary state.
Projects like SafeMoon “tax” token owners when they sell. BankX takes a different approach. Sellers of the BankX token capture the full market value at the time they sell while the IPOL system burns tokens, if needed, to ensure the system remains net deflationary.
Furthermore, BankX does not charge transaction fees in our liquidity pools. Buyers and sellers of XSD and BankX are drawn to our liquidity pools due to no fees, concentrating liquidity in the BankX decentralized liquidity pools. Because no fees are earned, there is no incentive for liquidity providers to add liquidity to pools that the BankX protocol doesn’t own. The only incentive for the market is to sell liquidity ensuring a 100% Protocol Owned Liquidity Pool structure.
Peg stability analysis
- Introduction
- The purpose of this analysis is to prove that BankX’s peg is going to perform as expected. Given that BankX is an algorithmic partially-collateralized stablecoin, it makes sense to compare it against Frax. In this section we will prove that Frax is a very efficient stablecoin, and we can therefore assume that this part of BankX will behave in a similar way.
- Frax breakdown
- The graph below shows the performance of the peg of different stablecoins. While some stablecoins have failed, Frax seems to have the most stable peg.
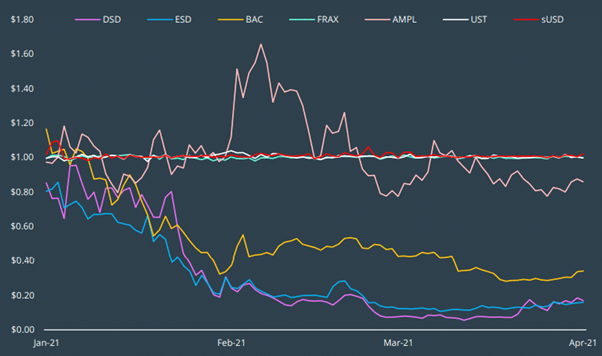
Stability performance of pegged algorithmic stablecoins
Source: https://albaronventures.com/frax-finance-analysis/ (original source Coingecko)
This was achieved while the market capitalization of the FXS was under $20 billion. A sudden spike in volatility in November does not seem to have affected the Frax peg, which at worse, has drifted off to $1.02
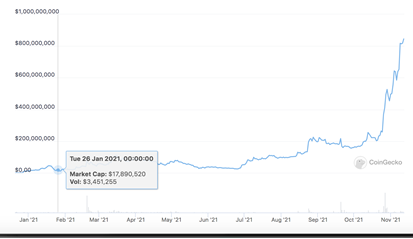
Market capitalisation of FXS. Source: coingecko
As it is clear from the graph of FXS marketcap and the FRAX price, the stability of FRAX seems to be decoupled from FXS volatility.
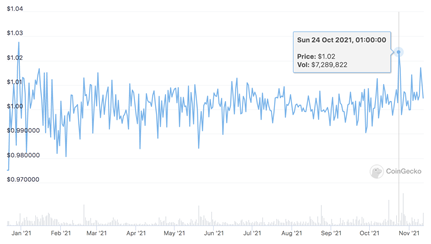
Price of the Frax stablecoin. Source: coingecko
The correlation between the FRAX stablecoin and the opening price of the FXS token was calculated on data over the last 200 days (as of date 12th November 2021). The correlation was estimated to be around 0.2, which is significant, but by no means a strong correlation.
A rolling 100-day correlation shows a fluctuating relationship between the two variables, which never exceeds 0.5
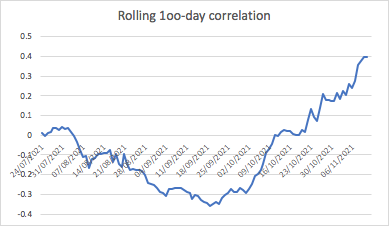
Therefore, the following conclusions can be drawn:
- An algorithmic stablecoin that follows a protocol similar to FRAX should be expected to have an excellent peg.
- The supporting token and its volatility do exert an effect on FRAX’s price. However, this correlation is never high, and has never managed to break the peg by a significant amount, or impose a trend.
Note that at the time of writing, only about 20% of the collateral of Frax is in the FXS token. It looks like that partial-collateralization strategy helps stabilize the system.
Hence, it should be expected that the peg of the XSD token is going to be stable, and not closely correlated to the BankX token’s volatility.
Negative case study: https://cointelegraph.com/news/dynamic-set-dollar-faces-massive-test-as-stablecoin-falls-as-low-as-27
- Comparison of different stablecoins
- The table below shows comparisons stats across the different most popular stablecoins2. The maximum deviation describes the maximum absolute difference from the peg that was ever recorded.
| Stablecoin | Maximum deviation | Standard deviation |
|---|---|---|
| Tether | 0.08 | 0.01738971 |
| USDC | 0.03 | 0.00538763 |
| Binance USD | 0.05 | 0.00351076 |
| Terra | 0.13 | 0.00745322 |
| DAI | 0.093 | 0.01049843 |
| Frax | 0.1 | 0.00687162 |
Traditional stablecoins like Tether and USDC do not outperform the alternatives. The standard deviation is by far the most important metric, and as it can be seen all solutions have very similar, close standard deviations, with Binance USD and Frax having the smallest standard deviations of them all. While Terra experienced a significant crash at one point in its history (analyzed in the marginal cases below), it has still maintained an excellent peg, by using a purely algorithmic approach.
Game theoretic analysis of bonding curves
The bonding curves used by BankX present an interesting game-theoretic dilemma to the players of the system. Without loss of generality, let’s assume that the bonding curve of the collateral deficit is defined as follows
The above graph represents the formula f(x)=log(x)*0.1+1
In this graph, the maximum tokens returned are close to 150%, and the minimum is 100% (Which corresponds to rewards of 50% and 0% of the collateral provided). The minimum reward represents a point where the system is 100% collateralized and the user is simply getting 1 BankX token for each equivalent amount in ETH provided (based on the current decentralized oracle market price).
So, let’s assume that we have a simple system of 2 players, and that the rewards issued are at some point R, where
0% < R < 50%.
That is, the rewards are between the maximum and the minimum.
The interesting dilemma arises because every time someone provides the collateral requested, the bonding curve automatically adapts, and lowers the provided reward. Let’s assume that BankX has found itself in a position where the collateral seems to be going down and down, and it requires the bonding curve mechanism to provide incentives to stabilize the system. Such a case, for example, can be one of the marginal cases outlined below.
The players, have 2 options each
- Wait and collude with the other player. One person can provide all the collateral required, and then the 2 players halve the reward.
- Ignore the other player and provide the collateral themselves. This will give them a reward R, and then the second player will get a reward K ﹤ R, based on the new reward scheme.
Note that the options to provide liquidity simultaneously does not exist, as the system can simply decide that if this happens (which is practically very difficult), then it can choose one of the providers at random, to be decided to be the first one.
This can be summarised in the table below.
| Wait and collude | Move in first | |
|---|---|---|
| Wait and collude | 50% (split in half, hence 25% each) | K (which is less than R), R |
| Move in first | R, K (which is less than R) | Not possible |
Hence, the players are incentivised to move in first, if in this case, if R > maximum_reward/2. Therefore, we should expect that the rewards provided in practice will never reach the max. A full analysis which includes an arbitrary number of players and collateral amounts is not provided, but the argument above should suffice to prove that point. If anything, adding more players into the game, including automated players (i.e. bots), makes collusion even more difficult.
Another point which is important to mention is that bonding curves provide rewards on a vesting schedule. Therefore, it is not possible to perform flash loans attacks, or any other kind of arbitrage scheme, as the bonding curve locks the reward for a certain amount of time.
Options include:
- Fixed vesting schedule
- Use a curve to determine the vesting schedule using the reward as an input, or the collateral ratio.
- Maybe add a small random number to the total number of days/hours for the vesting schedule, to ensure that it is difficult to synchronize rewards, even if someone wanted to do this.
Marginal cases analysis
Introduction
The purpose of this section is to analyze some marginal cases of the system. These are scenarios that might be unlikely to take place, but could challenge the stability of the system.
Case: BankX token interest rate vs collateral ratio
The current theory behind the BankX token is that the interest rate of the BankX token is going to be 50% of the collateral. In this section we will justify why this is the case, and prove the conditions under which this might or might not work.
Why:
- The justification behind this is that as more faith is accrued in the system, then the system should be able to reward users more.
- This mechanism incentivizes users to mint XSD. (Demand for XSD is what lowers the % collateral of the native blockchain cryptocurrency)
Assumptions:
The assumption assumes that the BankX token has enough price stability, to the extent that simple volatility alone does not risk under-collateralizing the system.
Critical analysis:
For this part we will use marginal case analysis. We will examine what can happen in a worst case (but unrealistic scenario) and try to prove whether the system is immune or would collapse.
Without loss of generality let the total supply of the BankX token be 2 billion. Let us assume that the system is 100% collateralized by BankX Tokens.
Let us assume that all the users try to get their rewards within a time span [t, t+k], that is very tight, but large enough to allow market dynamics to update the price.
This can be, for example, 1 hour. We can assume that many of those users trying to get rewards are actually bots.
This has the effect of 1 billion BankX tokens flooding the market within a small time interval. The following scenarios are at play:
- The interval is very narrow, and the users do not have enough information about the price. This can happen, for example, because the bots are set to automatically perform this action (collect rewards).
- The users (or bots) actually track the price of the BankX token before requesting rewards.
As more BankX tokens flood the market, this has the effect of lowering the price of BankX tokens, and potentially under-collateralising the system and XSD becoming undercollateralized.
In that case, the fair value of XSD could go down below the price of 1 gram of silver, breaking the peg.
The BankX system provides 4 solutions when XSD is below the peg:
- Add collateral with incentives on the bonding curve.
- Redeem collateral.
- Burning XSD for BankX profiting in the arbitrage opportunity.
- Buy XSD.
- Incentivising CDs, by offering more attractive rates through a bonding curve.
Case: Collateral ratio and volatility
Problem introduction
A risk to the BankX system exists around the volatility of the BankX token. More specifically, as the collateral ratio increases (and hence the bankx token represents a larger proportion of the collateral of the BankX system), the volatility of the BankX token becomes important, as the system can find itself under-collateralized.
In this analysis we will use the FXS token as a starting point, before discussing how these results can apply to BankX, which follows a similar protocol.
Preliminary analysis
Let S be the total monetary value in $ of BankX token that needs to be stored to keep the collateral ratio at its current value. Note that we are agnostic about the actual collateral ratio when defining S, as this could be 30% or it could be 100%
Let’s extend these variables to include the notion of time. We can define our objective as
P(P_t>=D_t) for the interval [t,Inf]
Let the standard deviation change according to a stochastic process. There are different possibilities in this scenario, from a martingale, all the way to stochastic processes where there is some underlying concept drift.
The standard deviation of daily closing price of the BankX token can be approximated by a log-normal distribution 3.
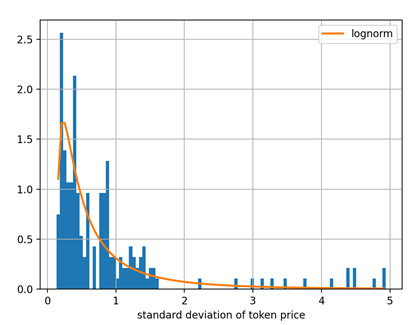
Using the cumulative distribution function we can identify that there is less with a probability of 95% the rolling standard deviation is under 2.75.
Conclusions
The results of the previous section mean that we can define a margin of safety as follows:
P-2.5 >= T*P/S =>
P >= T/S +2.75
Therefore, the price needs to be larger than the ratio of (total BankX tokens in circulation)/(total monetary value of BankX tokens staked) plus the constant 2.75.
So, let’s see an example. Let’s say that there are 2 billion tokens, and they are used to collateralize $2 billion. This gives
P > = 2billion/2billion + 2.75 =>
P >= 3.75
Therefore, if the price is above or equal to 3.75, then there is only about 5% probability of the system suffering under collateralization, based on historical data from Frax.
Solution mechanism
The solution to this problem is to use bonding curves that offer more rewards the more collateral that is needed by the system. The way that bonding curves work was covered earlier in the document.
Marginal Case: The Terra Luna crash
The biggest loss of a stablecoin peg experienced by any major stablecoin was the infamous TerraUSD crash in January 2021, followed by May of 2022.
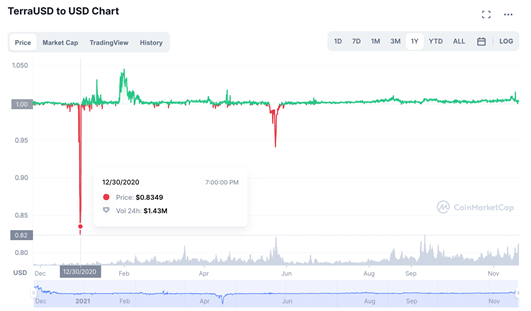
This was documented on Twitter by the Terra Luna team. In short what happened was that the protocol is built to handle redemptions of up to $20M. Terra has an on-chain swap mechanism where anyone can swap 1 LUNA for 1 USDT and vice versa. A large number of redemptions of Luna to UST on anchor protocol led to a total volume of $80M. The peg of UST went below $1, hence creating arbitrage opportunities. The peg was eventually restored.
In May of 2022, Terra Luna suffered a complete depegging of its stablecoin. At that time, it was the 3rd largest stablecoin with market cap of $19B. Terra Luna had expanded to other chains providing liquidity rewards which increased demand for UST. Further, Terra Luna, through its Anchor Protocol, was giving very high returns of 20% for staking in the system. Some claimed this was a Ponzi scheme by the way they were paying these returns. 80% of all the UST in circulation was staked in the Anchor Protocol. Sensing a problem, The Luna Foundation Guard raised capital to back 20% of UST with BTC. This signaled to us that the Terra Luna protocol knew their fully algorithmic stablecoin was not going to be able to maintain the peg.
On Saturday, May 7, Terra withdrew a large amount of UST from Curve while an unknown whale sold $85M of UST for USDC pushing UST off its peg. This scared the market and lots of people began withdrawing from Anchor to the tune of $9B of the total $14b in just 48 hours. These withdrawals were swapping in to other stablecoins further depegging the Terra Luna stablecoin. The market began burning UST for Luna and selling Luna crashing its price. Luna's market cap fell below the value of UST which is known as a death spiral effectively killing the protocol. By Friday, May 13th, $40B had been lost.
While a full analysis of this case study is out-of-scope, it is worth mentioning, because we need to ask: “would the same thing happen to BankX”? In the case of Terra, the Luna token acquires value through the ecosystem. The fact that the system is algorithmically stabilized presents severe vulnerabilities which do not exist for partially collateralized stablecoins like Frax and BankX. We feel a fully algorithmic stablecoin cannot succeed and needs collateral. Attacks on the peg will eventually succeed with an algorithmic stablecoin so collateral is needed to give full faith in the system. The Terra team clearly saw this and began trying to back the stablecoin with collateral but they were too late. In case the system experiences dramatic volatility which leads to it being undercollateralized, BankX has a series of mechanisms such as bonding curves or pausing withdrawals (collateral redemption restrictions), for a limited amount of time.
How bonding curves work:- The system is undercollateralized because of a random shock
- The system asks for ETH/BNB as a collateral, in exchange for an equivalent amount of BankX token+interest rate.
- The BankX tokens vest over a period of time that guarantees the stability of the system.
System-wide Economic Incentives
The figure below shows how the bonding curves connect different system-wide economic incentives. (Same as pictured previously)
The system is constantly balancing inflationary and deflationary mechanisms, in order to achieve the goal of A.N.D. The inflationary mechanisms ensure that the token is not going to experience limitless and wild appreciation.
Some mechanisms, such as CDs are both inflationary and deflationary at different times. For example, the user buying a CD is removing BankX tokens from the market, but then gets more tokens in reward over a period of time. Others, such as burning, are deflationary.
The effect of CDs and any bonding curve-related mechanism is shown below.
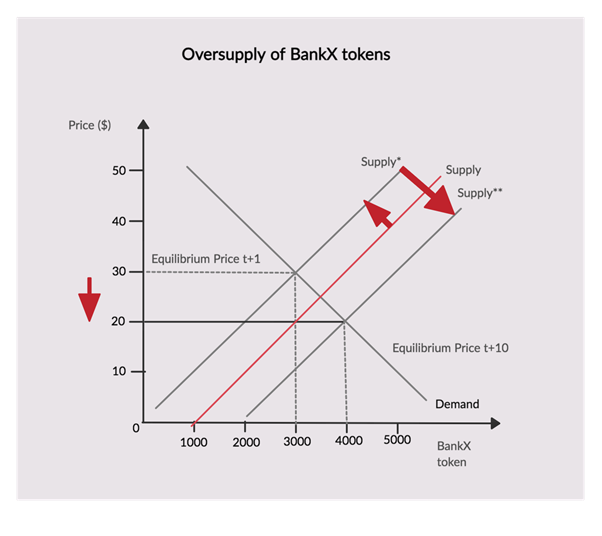
General effect of minting and rewards provided by CDs and bonding curves
The red line is the original supply of the BankX token. Issuing a CD has the effect of moving the original curve to Supply* at t+1. However, after a longer period of time (without loss of generality we can just say this is t+10), the curve moves to Supply** which lowers the BankX token price.
It is clear, that if the system used only CDs and staking to balance this dynamic, then it faces a situation where the only solutions are to provide CDs with longer vesting periods
For this reason, the system is implementing two burn mechanisms, which were also covered previously in the document, and copied again here
“The system does 2 things to get back to a deflationary environment when the system has identified the BankX token as “inflationary” (inflation is greater than staking):
1. 10% of newly sold BankX tokens into the Liquidity Pool (ETH/BNB vs. BankX only) are burned by the system.
2. If #1 doesn’t work, after a period of time, 1% of the total BankX tokens in the Liquidity Pool are burned each week until the system reaches a net deflationary state. “